
According to the American Hospital Association hospitals have faced massive financial strain in recent years, making reimbursement optimization more critical than ever. Payers generate reimbursement variances—that’s a given—but many start with breakdowns in people, processes, technology, and data across the revenue cycle.
Common examples include:
- Medical Necessity denials or contractual underpayments tied to documentation/process gaps
- Coding-related denials stemming from staffing or training issues
- Payer changes (quarterly updates, Medicare Advantage shifts, authorization rules, telemedicine adjustments) that aren’t operationalized quickly
- Prioritization should start with net reimbursement impact. Variances often occur in 7%–12% of claims even after rebilling and appeals, translating to ~1%–2% bottom-line impact from contractuals and ~2%–3% from denials
The good news: roughly 67% of denials are appealable, and 70%+ are preventable—but each reworked claim still costs about $25. That’s where modern revenue cycle analytics, strong denial management, and targeted revenue recovery services pay off.
Process Maturity for Identifying Reimbursement Variances
Process Maturity, as defined by Six Sigma, is outlined over five steps/levels.
Every hospital should have a Reimbursement Variance process in place for the first three components. Some organizations have these steps in place for just Denial Management, but they really should be in place for all variances.

Using Six-Sigma terminology shows that your organization or health system has a documented process set in place for all reimbursement variances.
Accountability:
This is the baseline data gathering and workflow process. This starts with the categorization of denial codes and contractual variances through revenue cycle analytics.
For denials, this includes grouping the CAS codes to Denial Reason and Categories such as Registration, Authorization/Pre-Cert, Medical Necessity, Missing Data, Medical Document Requested, Coordination of Benefits, etc.
For contractual variances, this includes, add-on reimbursement items, stop-loss provisions, multi-proc discounting, paid of prior rate schedules, etc.
As it relates to work-flow, Route worklists with clear user assignment and access to 835 detail and contract logic—via your patient accounting system and/or revenue cycle analytics platform.
Reporting:
This is the basic access to the data.
At this level, there are typically standard reports that provide a baseline operational insight for accountability. Report examples could include Reimbursement Variances By Payer, Variances by Category, Variances by Code, etc.
Prevention:
This is the overall goal of eliminating or resolving the issue.
This includes implementing system or process changes such as using a Denial Category or Denial Code reporting to drive changes in the EMR / HIS. The combination of reporting and analytics are the real catalyst or drivers of process improvement.
One thing to keep in mind is that prevention is described as the middle step or level on this maturity matrix but correcting and reversing the denial or contract is what creates more immediate cash flow.
Reimbursement variance recovery is a component of this level. If payer payment rules, coding requirements and patients stayed with the same payer with the same benefit plan forever, prevention would likely mean completely eliminating the problem.
Unfortunately these items are dynamic, meaning that we may not know what to prevent until something of value is denied—such as, the appeal is a part of the prevention step in that we still want to be paid for the provided services.
Another way to think about analytics is the concept of Root Cause Analysis.
Reporting provides quantitative insight whereas analytics should provide a quantitative as well as a qualitative assessment such as:
- The most common denials
- How much of an impact are the denials or contractuals having to net patient revenue
- The reasons for the denials
The two work together as drivers but the incorporation of benchmarks, and constant feedback loops is what separates analytics from reporting.
With Reimbursement Variances often occurring at a rate of 7% – 12% of all claims and after the rebilling and appeal process, it translates to 2 – 4% bottom line impact, this type of error rate is truly more unsustainable than ever before. To accomplish real improvement, measurements against benchmarks are critical.
After all, without measurements, we don’t know if improvements are being made and we don’t learn or know what is meaningful. Reimbursement management analytics should be built on the foundation of Performance Measurements. In the simplest form, it is an aggregation of 835 transaction sets, but more broadly, denial and contractual data analysis should include additional information such as the expected reimbursement to understand the impact on net patient revenue.
For example, many hospitals report denials using total charges.
However, this often prevents you from effectively prioritizing your denials and driving cash in the door. Just because a Medicare account has a $10,000 denied charge, it doesn’t mean it is more valuable that a BCBS account with a $5,000 denied charge. We have to constantly remind ourselves that Performance Measurement is a continuous process that involves checking the performance against a determined standard or target. When an external standard is not available or may not seem applicable to you, an analysis of your historical data can be used to establish a target. The critical point is to establish your targets.
Benefits of Data Visualization
With the current reimbursement variance rate of 7% – 12% occurring with all claims and after the rebilling and appeal process, denials and contractuals continue to be a challenge. One way to help move the process forward to the next level of Analytics is Data Visualization. Using real-time data visualization, managers can view the latest figures and see the current overall account activity and denial code volume and respond more quickly to potential growing issues.
For example, a static denial report may inform a manager that the overall denial rate with a payer is up for a particular month. However, it won’t inform them on why they are up. Visualization with drill down ability allows the user to quickly assess and determine the root-cause allowing staff to be adjusted to address a volume increase mid-month. This type of analysis requires some baseline principles including starting the data capture process with accurate and detailed underlying data. Summary data will limit your ability to drill-down to the real insightful level.
In fact, according to an interesting survey by the Aberdeen Group, it found that managers in organizations that use visual data discovery tools are more likely to find relevant information compared to those who rely only on traditional management dashboards & reporting. It should also be noted that managers at organizations that use visual data analytical tools are 3 times more likely to comment and share a report or chart. With denial and reimbursement variance management, this helps facilitate a collaborative organizational effort when dealing with net revenue improvements.
So with net revenue truly being the bottom-line (no pun intended), contract governance really is the foundation for reimbursement variance analysis. What will this look like for your inpatient contract rates? Accurate reimbursement variance analysis should always start accurate calculations. But what should that look like in terms of data visualization?
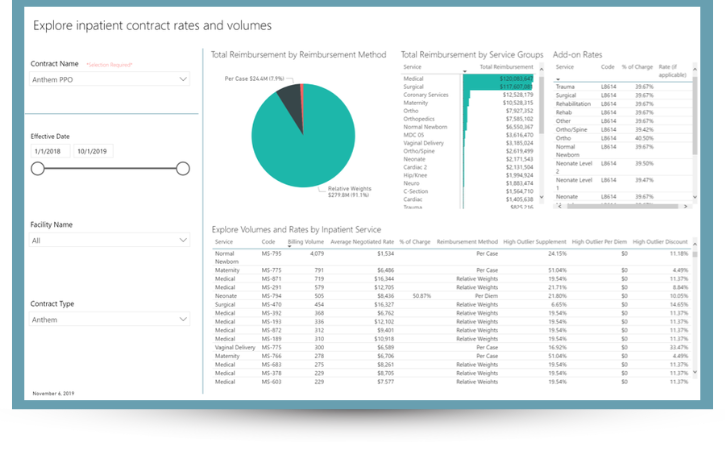
Here is a good example of a basic Anthem PPO contract.
A user can quickly see the reimbursement by contractual methodology, by service line, add-on reimbursement item and actual volume by each for Inpatient Services. This is also a great example of what the industry is grappling as it relates to the upcoming Price Transparency mandate requirement scheduled for 1/1/2021. In the final rules, CMS outlines the mandate requires hospitals to post their baseline rate schedules for all payers and all plans. Their assumption is all hospitals have tools that can easily and quickly produce this type of information.
Unfortunately, many hospitals still bill charges and allow the payer to compute the payer allowable which leads to variances. If the mandate holds up, the right data analytics platform will help lead you to a more efficient Contract Governance process and an easier process for staying compliant with Price Transparency requirements.
Overcoming Challenges with Reimbursement Variances
Pair analytics with governance to target the highest-value opportunities:
- Executive dashboards: Track net revenue gains and trendlines vs. targets.
- Payer scorecards: Rank opportunity not just by charge volume; surface payers with the biggest collectible gaps.
- Trend monitors: Watch denial reasons over time—e.g., clinical vs. front-end authorization—then fix the root cause.
- Recovery analytics: See which payers, denial codes, underpayment tranches, CPT/DRGs, and facilities deliver the best recovery yield—and double down.
Result: faster revenue recovery services impact and fewer preventable denials.
Digging a little deeper into the opportunities component, we have an example of a payer scorecard.
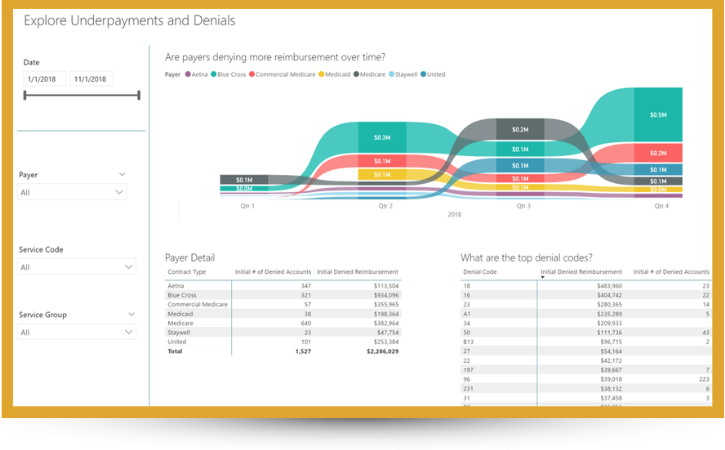
This scorecard allows you to see which payers have the greatest opportunity in comparison to which payers have the greatest charge volume. As you can see in the example, Medicare has the highest charge volume but is not the top payer with the greatest opportunity. Effectively prioritizing your denial/underpayment opportunities will drive cash in the door. A high amount of denials are appealable and a significant amount of them are preventable, however. Utilizing data and visual analytics, you can see over time if payers are denying more reimbursement. This also gives you the ability to review payer detail and top denial codes. Are there clinical factors that need to be addressed? Is this a front-end authorization issue? This information allows you to explore the root cause, resolve the issue and prevent it, going forward.
Now that we’ve reviewed how to locate the payer opportunity, let’s review where we recover the greatest underpayment amounts.
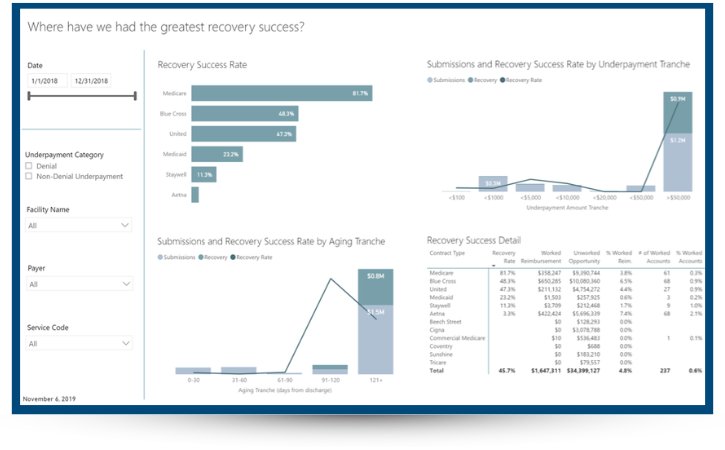
In this example here, you have a very helpful data visualization of where your collections come from. It allows you to distinguish between denial recovery vs non-denial recovery.
By facility—do you have one facility that is outperforming the rest or one that may need additional resources or attention?
By payer—which payers account for the majority of your revenue and is that what you expected?
By auditor—who is your top collector and who may need additional training? What tips can your top collectors offer to your bottom collectors?
As a manager, to be able to view this data allows me to be able to respond more quickly to a potential growing issue. Now taking that one step further, the next questions becomes “how can we identify issues and use analytics to improve our recovery process?”
This recovery analytics report presents recovery success rates in various ways.
For example, you can see which payer you have the greatest recovery success with, which underpayment tranches you’re most successful with and even break that down to which procedure codes and even which denial codes am I most successful with. And, then use this insight to optimize your payer recovery processes.
How to Manage your Collector’s Performance
With all this extra work, how can we best manage collector’s workloads?
We start with an optimized documented workflow process utilizing reporting and analytics for faster revenue recovery. We all know how tedious healthcare can be and how important bringing in the revenue is. Having an optimized and efficient workflow process is key for improvement.
The examples below show two collector work queues. It’s simple yet effective. This collector knows the number of accounts in their work queue, their work queue balance, their average day’s age, and average balance.
Example 1: What is in my work queue?
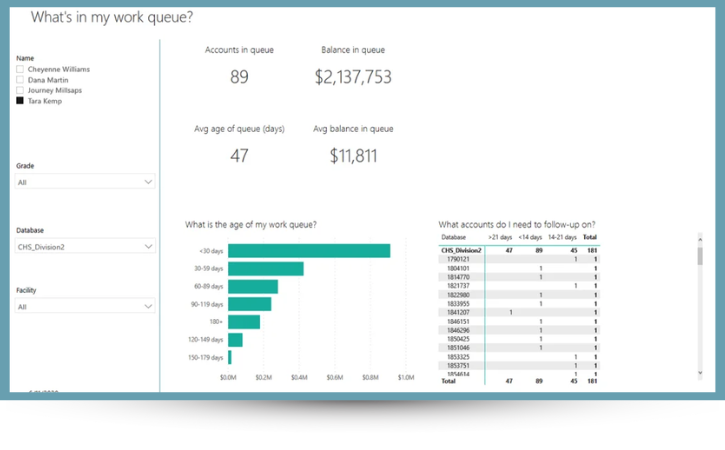
How does my payor’s performance compare?
There is a visual representation of how much money is in each aging bucket and a list of accounts they need to follow-up on for the day. We want to utilize analytics and visual representation so there is no guessing in what needs/should be worked and when.
Along with the collector work queue, it’s helpful to utilize a scorecard that helps to measure and compare performance by collector. This can enable an organization to easily identify their top performers or those that may need additional assistance.
This data visualization tool provides an ideal way to incorporate performance measurements and enable users to view and understand their performance.
Hospitals Need a Contract Management Strategy
When all is said and done, the key point to remember is that contract management is only going to get more complex. A durable approach combines revenue cycle analytics to quantify net impact, robust denial management to prevent/appeal efficiently, and revenue recovery services to capture missed dollars while process fixes take hold.
Payers’ contracts have gotten larger and managing them on a consistent level will become even more challenging, which means implementing the right analytical tools to meet the current and future challenges has never been more important to your organization’s bottom line.
